NB. This is only a sample.
This is an old method, which assumes that the tide comes in and goes out at the same rate. This means that the tidal curve will be roughly symmetrical. It does not always do this of course! NB; see tidal curves on page 62 PNT. Pretty strange tidal curves there! I will talk about them in a minute. Also this method assumes a six-hour tidal duration from HW to LW. You know this is also not correct.
However as a quick, easy method when the tidal curve is roughly symmetrical, it is adequate.
Here’s how.
All you do is find out the Range. (Take LW height from the HW height)
Divide the range by twelve.
See the table below to see how many twelfths of the range move for each hour.
| 1st hour | 1/12 |
| 2nd hour | 2/12 |
| 3rd hour | 3/12 |
| 4th hour | 3/12 |
| 5th hour | 2/12 |
| 6th hour | 1/12 |
I’m afraid there are lots of errors and they affect both methods.
Blow water around, so they can blow water out of the harbour and therefore reduce the LW height and hold down the HW height. Or they can blow water in, holding up the LW height and increasing the HW height.
This effect can be very important. Changing heights by metres not centimetres!
Heavy rainfall
Particularly in rivers, the amount of rain water can affect the height of tide considerably
Can also affect tidal heights. High air pressure "pressing down" on the sea will hold down HW and lower LW. Low Pressure "sucking up" on the sea will give a higher HW and higher LW.
If the above factors happen to stack up on one side, there can be a major difference in the height of tide. eg. With a high pressure system sitting over UK and a Low over France. Strong easterly winds hold back the flood tide in the English channel and therefore reduce the tabulated height prediction. This high pressure is also pushing down and stopping the tide flooding. Highs also tend to give fair weather so no rain water in the rivers. All this will reduce the height of tide.
If however we have a low pressure system in the south west approaches to the UK. Lots of strong SW wind blows the water up the channel (raising the level) Low pressure allows the the tide to flood and we would also expect heavy rainfall which also raises levels. If this situation occurs at spring tides, we can expect flooding.
These errors, which are not allowed for in the methods above, are very difficult to calculate. So always leave yourself some room for error. They are however not the biggest cause of tidal height problems for the yachtsman.
No the biggest cause is...
- The wrong day!
- UT and BST mix-ups.
- Using LW time instead of HW.
- Misunderstanding the scale on the tidal curve.
- Blunt pencils!
- Not using a straight edge.
- Changes in chart datum in short steep rivers.
Some of these errors are only tiny, but if they all happen to stack up together, they can be significant.
Changes in chart datum
 A
few words about the changes to chart datum. Where you find short steep tidal
rivers, eg Fowey, Dartmouth, Truro etc. There are often little insets on the
chart like this one.
A
few words about the changes to chart datum. Where you find short steep tidal
rivers, eg Fowey, Dartmouth, Truro etc. There are often little insets on the
chart like this one.
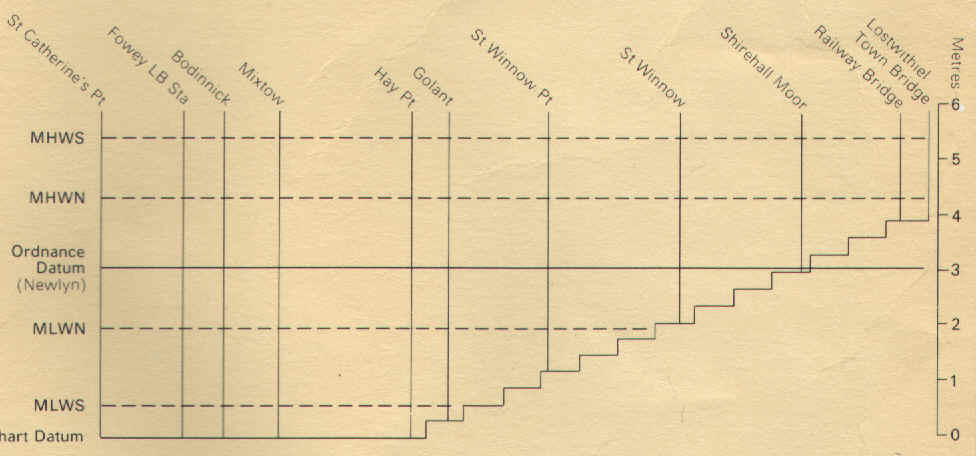
The simple way of understanding this is to think about the charts colours. As
you know, where the blue meets the green is chart datum. At lowest astronomic
tide, it is just dry at that point. The rub is that although it is low tide at
Fowey, there is still fresh water coming down the river and at lostwithiel it is
not completely dry because of this water. There is water at Lostwithiel, but to
have any rise of tide there we must have a height of tide at Fowey of almost
four meters. The green meets the blue all the way up the river, but it is not
the same level. Chart datum changes and you must use the table!
Loads chopped here
Computation of rates table
Have a look at the inside cover of the Practice Nav table. There you will see an example of a computation of rates table.
It is used to compute the tidal stream when the range is not close to the mean spring or mean neap ranges (most of the time). If you find that the range of tide is half way between springs and neaps, then just use the mid point between the two given rates in the atlas. However if as is usually the case, you have some other range, then use the table below. it is much easier than maths!
It is very simple to use. Use the RANGE of tide at the reference port (in the above example 4.9m) and use the two tidal rates (mean spring and mean neap) as shown to find an accurate rate of tide in knots.
Exercise 16